Image
- Collect and store data of remote input/output modules over network
- Monitor real time data or review stored data on an iPhone or a Mac
- Control relays or digital out channels remotely on an iPhone or a Mac
- Analog Graph view and Digital List view
- Raw data can be converted to common units with conversion
- History data can be viewed by specifying date & time range
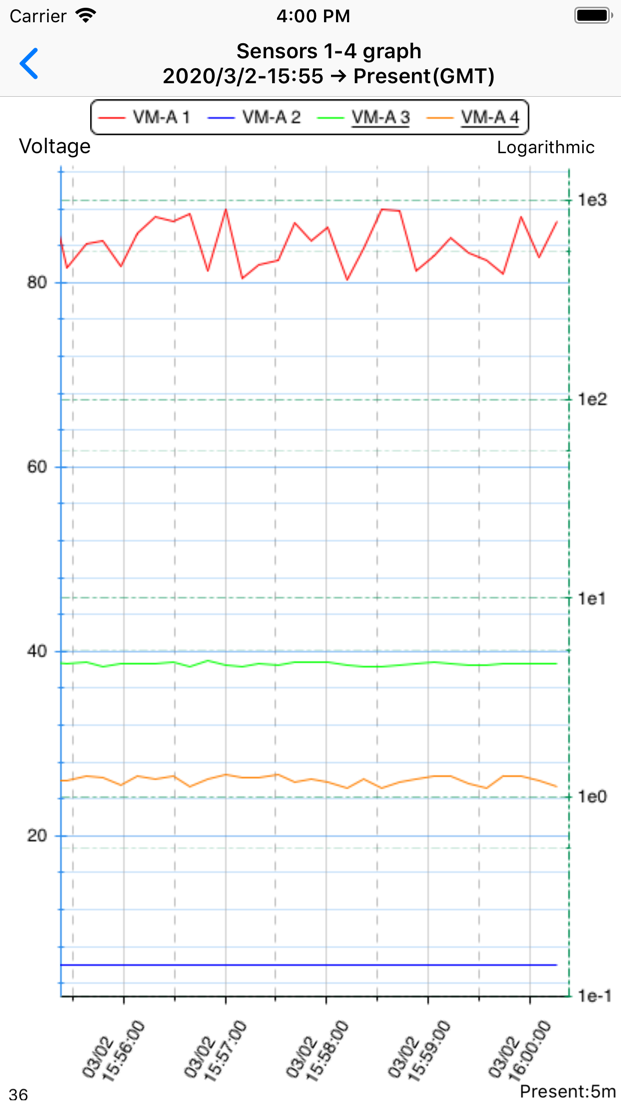
Analog Graph View
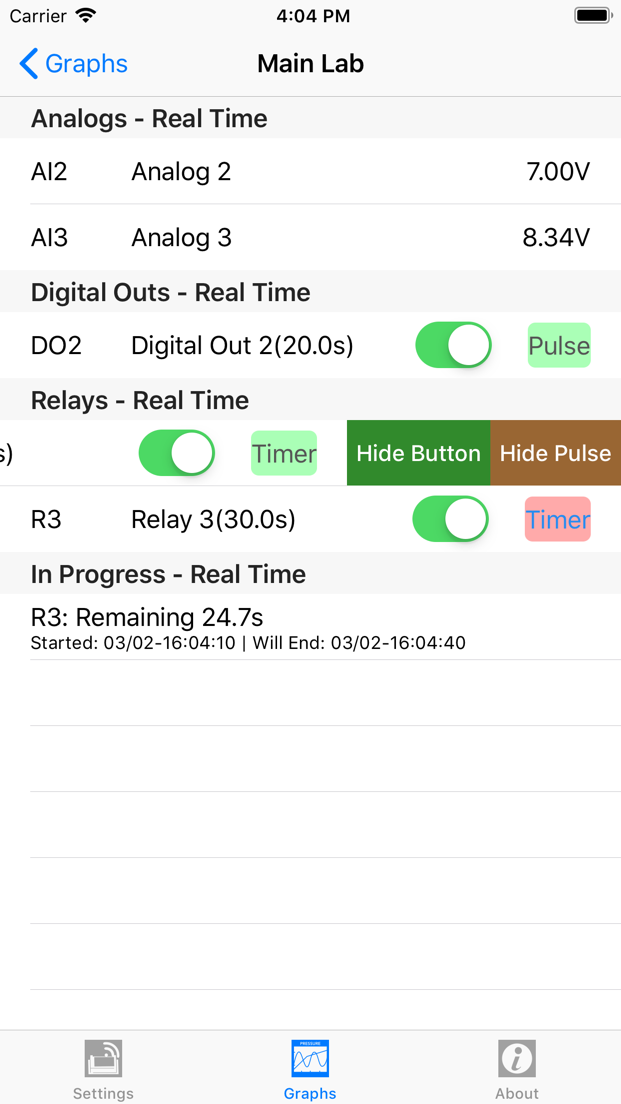
List View
Features
Graph View supports:
- Realtime Plot
- Automatic scroll to current data
- Specifid time range plot
- Various line colors/weights
- Various Symbols and colours
- Tap to view value on data point
- Dual Y axes
- Relay controller on a graph
- Conversions to data line
- Create own conversions
- Graph setting backup/copy
List View supports:
- Realtime data update
- Visual presentation of the state of digitaph inputs
- Relays/digital outpus control
- Hide control buttons
- Timer progress display
System Requirements:
- Device: iPhone, iPad
- iOS version: 12.2 or later
- RIO DLUtility and a Mac
- Remote I/O device(s)
(currently only supports Teracom TCW241 and RPIO)
Getting Started
Requirements: RIO Data View app works with RIO DLUtility software which runs on a Mac PC and RIO DLUtility requires remote I/O device(s).
Step1: Register your RIO DLUtility
Tap "Server" row in the "Settings" tab view and tap "+" to add an RIO DLUtility server
Step2: Name your RIO DLUtility and Remote Devices (optional)
Tap "Edit" in the Server list view and Deivce list view allows to name your RIO DLUtility or device(s)
Step3: Create a graph (Graphs tab view)
Analog Graph has been created as an example.
Details of Graph configurations:
- Graph Name: Name of your graph
- Graph group: Graph group
- Datalogger for the selected Device: Choose one RIO DLUtility
- Select a Device: Select a device to plot its data
- Type of Graph: Graph plot or List view
- Channels: There are list of available channels, Tap required channel type and tick on channels to plot
- Graph Update: Realtime On/Off
- Interval (seconds): Specify update interval
- Data Range: Speciry by time range for data
- Y Axis: Here you can specify which selected channels to show on which axis
- Annotation: Anotation text or colour